
the experience of Greece as a member
of the European Union
(Implications for the Balkan economies in transition)
 |
Peripherality and integration the experience of Greece as a member of the European Union (Implications for the Balkan economies in transition) |
By
Velissaris Baliotas,
Economist,
Eurotechniki K.E.K.,
Volos, GREECE, 1997
Contribution to the
EDUVINET "Living
Conditions of EU Citizen" subject
Acknowledgement: We would like to thank you Mr. Georgios Petrakos, University of Thessaly and Mr. Christos Pitelis, University of Cambridge for their help to collect the data and write this paper.
Table of contents
A. The performance of the Greek Economy
B. The Sectoral Structure of the Greek Economy
C. The Structure of the Greek Industry
D. The Trade Relations of Greece with the EU and the World
E. The Public Sector in Greece
F. Some Explanations for the Performance of Greece in the EU
The purpose of this paper is to present the integration experience of Greece, a country that is peripheral to the European Union (EU) gravity and development center in both geographical and economic terms. This experience may be useful to the other Balkan countries with similar characteristics, that have recently entered a phase of restructuring, marketization and openness of their economies, in their effort to gradually integrate with the EU. In the next section, we present the basic theoretical issues of the integration and convergence literature. In section 3 we analyze, using time-series and cross-section data, the most important aspects of the economic performance and structural change of Greece, using as a measure of comparison the EU and discuss its integration experience, especially during the last 15 years. Finally, in section 4 we draw our conclusions and discuss policy implications for the Balkan transition economies.
The pure theory of international economic relations indicated until recently, that trade between countries can be beneficial to all parties involved, provided that they specialised in products where they face the least comparative disadvantage (Ricardian Theory), or the lowest opportunity cost (Heckscher-Ohlin Theory). Few exceptions for protectionism were allowed, notably in cases of " infant industries". These benefits of specialisation and exchange, that occurred in the form of lower production cost and higher consumption and welfare levels for all parties, have been the ground on which free-trade policies and policies of economic integration have been justified. Simply stated, the formation of trade and economic unions among countries in a geographical region (for example Europe), based on the elimination of tariffs and all shorts of barriers to trade and factor movements, will leave better-off all participating country-members.
In recent years, this belief has been seriously questioned on various grounds. First, the economic development of Japan has been based on building competitive advantages rather than relying on existing ones. This development strategy that has not been fully committed to free-trade, raises questions on the appropriate policies of both the EU and the transition economies, but also concerns about the implications of its potential implementation by all parties involved.
Second, recent developments in the theory of international trade question the assumption of efficiently operating, perfectly competitive markets and explicitiy recognize the existence of imperfectly competitive markets and increasing returns. Under these conditions, it is possible that countries with high return industries can do better than others, raising the possibility for strategic trade policies by governments. These policies, that can take the form of subsidies, tax relieves and a degree of protectionism in support of domestic firms that generate positive externalities, make the extreme pro-free trade position unattainable.
The new theory of international trade has further implications related to issues such as the EU enlargement, integration and convergence. It is now widely recognized that imperfect competition can result in adverse effects, namely an uneven distribution of benefits from trade, including the possibility of some countries being net losers (Krugman 1989). This uneven distribution of benefits can come about through the existence of excess returns in imperfectly competitive industries, as countries with high return industries can benefit at the expense of others.
Further problems identified by Krugrnan include adjustment costs and income distribution problems, the later arising, for example, when trade leads to increases in unemployment in some countries. Moreover, such problems are likely to be accentuated as a result of enlargement. ln the case of the EU, the original member states were very similar in terms of economic structure and level of development. with trade being mainly intra-industry. Such trade is characterized by small adjustment costs (Grimwade 1989). Enlargement has given rise to inter-industry trade, with a more conventional specialization in labour-intensive, low technology production on the one hand and high-tech, capital- or skill-intensive industries on the other. This is likely to be associated with substantial adjustment costs and implies the possibility of significant costs in terms of unemployment for some partners.
The problems of imperfect competition can be further accentuated in the case of transnational corporations (TNCs). The inherent mobility of such firms has increasingly resulted in situations where national states have to bid' for such investment by 'theirs' and 'foreign' TNCs. In this competitive struggle. the winners will be those states that will be able to offer the best bargain to TNCs in terms of overall expected benefits. Considerations of labor costs, technology, infrastructure, market size, political stability, etc. (CEC 1993), become all important here, suggesting that some states may emerge as consistent losers in this competitive struggle. This is likely to be true. It is observed today that labor costs are becoming a decreasing part of overall production costs. Economies of time through for example, just-in-time production, can instead lead to substantial reductions in costs of production (Best 1990). This may tend to reduce the attractiveness of lower labor costs to TNCs vis-a-vis other factors. As lower labor costs is typically the characteristic of less-developed countries, the emerging new conditions may tend to remove a source of competitive advantage from such countries. This, may tend to reduce their bargaining power vis-a-vis TNCs. Moreover, the elimination of trade barriers seems to alter the spatial behaviour of TNCs, reinforcing on a larger scale the importance of Geographical factors such as adjacency, centrality or market accessibility and a more ordered spatial organisation of activities at the European level (CEC 1993). Overall, these factors may tend to imply fewer investment by INCs in such countries and more 'bad deals' over such investments.
A parallel to this literature concerned with the EU experience, pays more attention to the various 'endowments' available to the EU member states engaged in the process of integration. It indicates that the dynamics of integration may take the form of a 'cumulative' process, having an overall unfavorable impact on the performance of the less developed countries and regions. In the first place, it has been argued that the operation of the Single European Market (SEM) will intensify competition among unequal firms and strengthen the competitive advantages of the core regions that house the most efficient European enterprises (CEC 1991, Arnin et.al 1992). As a result, lagging behind states and regions may suffer directly from the implementation of SEM as they contain the highest share of sensitive sectors (CEC 1990, Camagni 1992)~ the weakest and most vulnerable economic base and an overall unfavorable geographic index of strategic location (Petrakos and Zikos 1996). In addition, policies towards economic and monetary union (EMU), may have a disproportionately adverse effect on the weaker member states, by largely depriving them from the means of fiscal policy and the means of monetary and exchange rate policy that allows them to compete with the more efficient members of the EU.
In addition, it has been claimed recently (Petrakos and Christodoulakis 1996) that the trade relations and the integration prospects of a country can be seriously affected by its geographical position and the geopolitical conditions prevailing in the region. In this argument, a peripheral country engaged in an integration process among distant and unequal partners will develop trade relations that are unbalanced and with a strong inter-industry character. In addition, if geopolitical realities -such as the 'iron curtain'- do not allow trade with the neighbors, then it is very likely that trade relations will have an unfavorable impact on the industrial structure of the country. Trade theory indicates (Gruber and Lloyd 1975, Greenway and Milner 1986, Grimwade 1989) that trade with neighboring countries is more intensive and usually takes an intra-industry character, implying greater room for more industries to develop, as international specializations are not mutually exclusive and the division of labor takes place within and not between sectors. Therefore, the strong reliance of a peripheral country on trade with distant and more advanced partners is very likely to result to two unfavorable for convergence effects: contraction of capital- or technology-intensive industrial sectors with serious adjustment costs and inefficiently small industrial firms, as the small size of the country and the lack of accessible nearby markets with a critical size, does not allow industrial firms to benefit from economies of scale.
To summarize, imperfect competition and strategic trade policies, competitive bidding by states and the spatial behavior TNCs, as well as unequal initial 'endowments' and geography, are all factors which, at least in principle, may operate in ways that hinder convergence within Europe.
Greece joined the EU in 1981 (3) after a long period of accesion, with mostly political arguments in support of this decision (4) and arguably, totally unprepared to deal with the economic consequences of membership. This decision was taken by the New Democracy (Concervative) Party that was in power in the period 1974-1981, despite the strong criticism and oposition of the other (mostly Socialist and Communist parties of the Parliament. Today the political rhetoric and debates of the late 70s over EU membership seem distant and rather irrelevant, as a more pragmatic and less ideological approach has prevailed with regard to the place of Greece in the international economic environment (5). However there is still a lot of scepticism about the implications of membership on the economy, as low growth rates, industrial decline and rising unemployment are considered as symptoms of the limited ability of the economy to compete in the single European market. Dissatisfaction might have been stronger and voices of protest against EU policies a lot louder, should significant assistance had not been provided to the less advanced regions of the EU in the form of the Community Support Frarnework (CSF I and Il).
In this section we present information about the structure and performance of the Greek economy in comparison with the EU average in key statistics such as GDP growth rates, GDP structure, industrial structure, trade relations and government. In most cases we cover a relatively long period of time and take a comparative approach. Since Greece joined the EU in 1981, our purpose here is to compare over-time the performance of the Greek economy to the EU average, paying particular attention to the performance of the economy in the post-1981 period. On the basis of these statistics we attempt a preliminary evaluation of the impact of the EU integration process on Greece and provide some explanations that may be useful to transition economies in the Balkans.
A. The performance of the Greek Economy
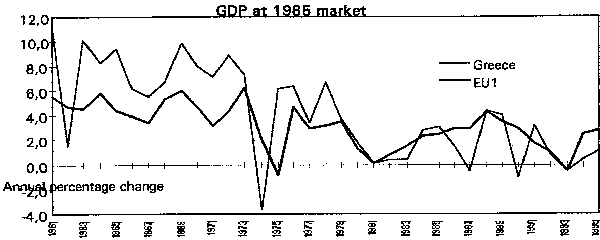
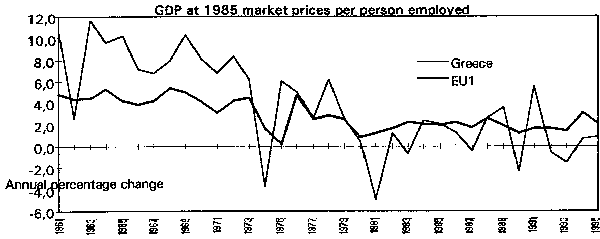
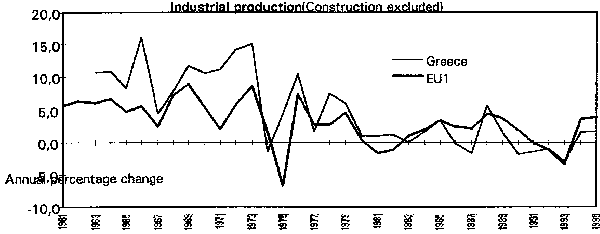
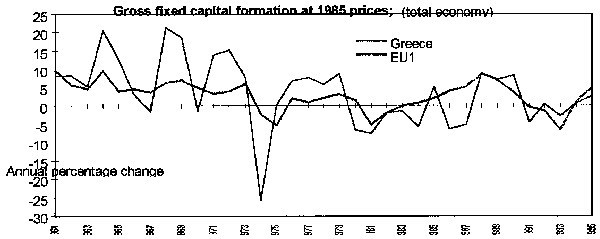
The performance of the Greek economy in the last four decades is shown in the next Tables and Diagrams. Table I and Diagram I present the annual percentage change of real GDP, labor productivity, industrial production and total gross fixed capital formation for the period 19611995. We observe that Greece has in all indicators a considerably better performance than the EU average in the 1960s and the 1970s (6), but a weaker performance than the EU thereafter. Real GDP has been growing in Greece with an average rate of 7.6% in the 1961-1970 and 4 . 7% in the 1971 - 1981 period, better than the EU average, that was 4 . 8% and 3 . 0% respectively for the same periods. In the 1980s however this picture changed and Greece (growing with an average rate of 1.5%) had a weaker performance than the EU (that experienced a 2.4% growth rate), a trend that continued also in the early 1990s. Interstingly, the performance of Greece compared to the EU average, declined immediately after Greece became a member of the Union.
Similar trends are also observed in all the other variables of Table 1. For example, labor productivity has been growing in Greece (EU average) with an 8.5% (4.6%) rate in the 19611970, a 4.0% (2.7%) rate in the 1971-1980 and a 0.5% (1.9%) in the 1981-1990 period. Industrial production has increased in Greece (EU average) with a rate of about 8% (7) (5.8%) in the 1961-1970, 6.9% (2.8%) in the 1971-1980 and 1.0% (1.7%) in the 1981-1990 period. Similarly, Gross Fixed Capital Formation has increased in Greece (EU average) with a rate of 9.3% (6.1%) in the 1961-1970 period, 2.8% (1.6%) in the 1971-1980 period and 0.0% (2.4%) in the 1981-1990 period. It appears that over time the performance of Greece can be divided in two periods: the period 1961-1980 where Greece is doing better than the EU average and the period 1981-1995 where Greece is doing worse than the EU average. It is interesting to note that in the 1981-1990 period, Greece is in a unique situation with a performance in all four indicators that is not simply worse than the EU average, but also worse than any other single member State of the EU (EC 1995).
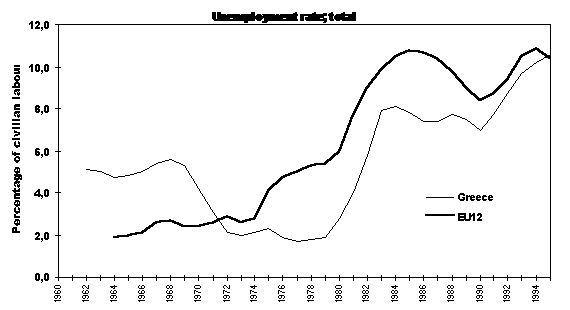
What we have here, is a case of a country that although in the 1960s was placed among the fastest growing OECD economies, in the 1980s it was ranked last among the EU economies. As a result of the sharp decline of the growth rate of output, the economy was unable in the 1980s to create sufficient numbers of new jobs, despite the expansion of the public sector. The unemployment rate increased from 2.2% in the 1971-1980 period to 7.1% in the 1981-1990 period and to 10.6% in 1995 exceeding that of the OECD countries and reaching for the first time the average rate of the EU (Table 2). It can be observed in Diagram 2 that as the performance of the economy declined both in absolute and comparative terms in the 1980s and the 1 990s, the unemployment rate increased faster than the EU average, in line with expectations.
Per capita GDP in Greece as compared to EU has also declined. Table 3 and Diagram 3 present two indicators of the relative position of Greece. The first indicator gives the share of the Greek to the EU GDP per capita measured in ecus and the second gives the share of the Greek to the EU GDP per capita measured in purchasing power system (pps). The first measure is based on the exchange rate of drachma with the ecu and is affected by the performance of the economy in the international markets. The second measure takes into consideration domestic price levels and is a better indicator of the relative purchasing power of income per capita.
Both figures show similar trends. Relative GDP per capita in Greece, measured in ecus, increased in the 1960s, reaching its highest value in 1970 and decreased thereafter, with some signs of stability in the 1990s. In 1995 however, Greek GDP per capita in ecus was equal to 45.4% of the EU average, a figure considerably lower than that of 1981 (52.8%), 1971 (58.2%)or even 1961 (49.1%).
Similar, albeit less profound changes appear with the examination of the relative GDP per capita of Greece when taking into consideration its purchasing power. The variation in this figure is smaller and the share of Greek GDP per capita to the EU average is in general higher than the one measured in ecus, especially from the 1970s and thereafter. The basic trend however is maintained as the figure increased up to the late 1970s and decreased in the period thereafter. Thus in 1995, the average income in Greece could command or purchase goods and services equal to 57 3% of those that could be purchased with the average income in the EU. This figure is still lower than the 1978 one (64.6%), which was the highest in the entire period.
B. The Sectoral Structure of the Greek Economy
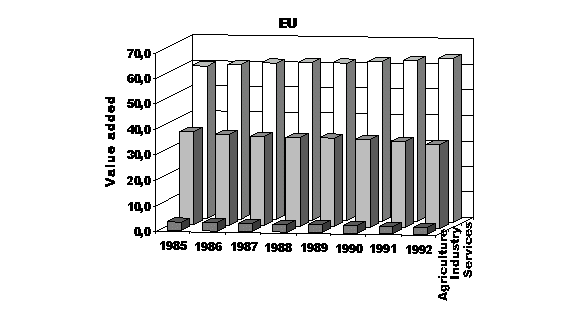
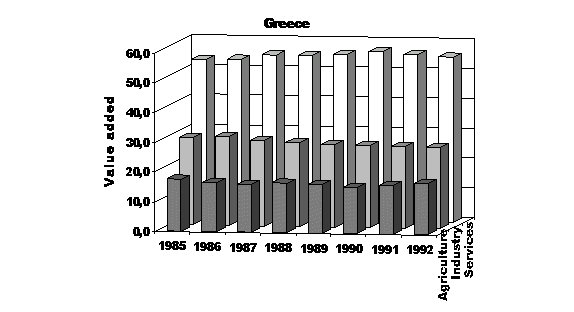
In Table 4 and Diagram 4 we present information on the sectoral structure of economic activity for Greece and the EU, measured by value added, in the period 1983-1992. We observe that there are a number of significant differences between the two economic structures. First, Greece appears to be a unique for Western Europe case with a share of primary sector equal to 17% of GDP in 1992, that is almost seven time greater than the EU average. In addition, this high share appears to be constant in the period 1983-1992, while the already low figure for the EU average has declined even further during this period.
Second, comparing the Greek share of industry in GDP to that of the EU average we observe that, although both figures decline over-time, the Greek share is consistently lower than the share of the EU by a margin equal to about 6 percentage points. Third, the share of services in GDP is increasing over time for both Greece and the EU, but the share of Greece is consistently lower than the share of the EU by an increasing margin equal to 9 percentage points in 1992.
Overall, Greece shows a high dependence on agriculture that is not compatible with the profile of other developed countries. Industry's composition by sector and size also seriously diverges from the EU average (see Tables 5 and 6). Finally, services have a composition that is by no means similar to that of the EU either. Instead of a strong presence of banking, financial and business services highly interacting with industry, one would more commonly meet in Greece a tertiary sector dominated by activities such as small scale retail trade and personal firms of self-employed professionals (8).
C. The Structure of Greek Industry
While in the 60s manufacturing activity in Greece was the vehicle of development, in the 70s and the 80s its dynamism has been exhausted. This is shown in the declining average annual growth rate of industrial production, which from 10.1% in the 1961-1970 period fell to 6.9% in the 1971-1980, 1.0% in the 1981-1990 and became negative (-0.5%) in the 1991-1995 period. Similarly, the average annual growth rate of gross fixed capital formation declined from 9.3% in the 1961-1970 period to 2.8% in the 1971-1980 period, became zero (0.0%) in the period 1981-1990 and negative (-0.6%) in the period 1991-1995. At the same time, the share of manufacturing in GNP has declined from 21.3% in 1980 to 16.7% in 1993, which compared to an average EU share of about 23%, indicates the declining competitiveness of the Greek industry. This is expressed domestically with the rapid increase of imports and internationally with the sluggish perforrnance of exports.
The decline of Greek manufacturing in the last period is also expressed with a shift of investment and employment towards traditional activities and a contraction of the already weak and undeveloped intermediate and capital goods sector. Table 5 provides information on the composition of Greek and EU industrial employment for 1985 and 1990 by main sectors. The examination of this data reveals that different sectors have a different weight in industrial employment in Greece and the EU and also different performance in the 1985-1990 period. Capital, RTD and technology intensive sectors have a considerably lower share in total industrial employment in Greece than in the EU. For example the share of mechanical, electrical and instrument engineering in industrial employment was only 6.60% in Greece in 1990, compared to 24.23% in the EU. Similar, albeit less profound differences can be found in other industrial sectors such as transportation, metalurgy and production of metals. On the contrary, labor intensive or light-industry sectors have a significantly higher share in industrial employment in Greece compared to the EU. For example, the share of food, drink and tobacco sector in industrial employment was 19.59% in Greece and only 10.72% in the EU in 1990. In a similar way, the share of textiles (leather, footwear and clothing) was 13.66% (14.58%) in Greece and only 5.04% (5.64) in the EU in the same year.
As it can be seen in the Table, the structure of the Greek Industry does not show any signs of convergence towards that of the EU. On the contrary, it tends over time to diverge considerably, concentrating in traditional sectors such as food, textiles and clothes that in general characterize earlier stages of development. This orientation of Greek industry towards traditional branches has intensified in the last 15 years (9). At the same time in the international markets, traditional industries tend to shift towards Developing countries that appear to have significant labor cost advantages and compete for a larger share of the market.
As a result, the process of integration and internationalization has generated a position where Greece has on the one hand, a disadvantage compared to other industrial EU countries, in competing in markets of high-tech, RTD and differentiated products and on the other hand, a disadvantage compared to low cost countries in competing in traditional markets of labor-intensive and standardized products. This double pressure imposed by increasing international competition might have been an important factor related to the decline of industrial activity and its concentration in inwards looking sectors that often have a local character.
Industrial activity in Greece takes place in very small by international standards production units (Petrakos and Zikos 1996). In 1988, for example, 93.5% of industrial firms employed 1-9 persons, being classified as light manufacturing or handicraft units and this share remained almost unchanged for the last 20 years. As a result, the average size of firms has remained for the entire period equal to the very small figure of 5 employees per firm which, as Table 6 indicates is by far the lowest in Europe. Among the EU countries, Luxembourg, Netherland, Germany, France and Belgium (in that order) have the larger average firm size, while Portugal, Spain, Italy and Greece the smaller. This tends to indicate that, with the possible exception of the UK, a North-South or a core-periphery divide exists in the EU with respect to national industrial structures. Overall the countries of the 'core' (that include Netherlands, Luxembourg, Germany, France, Denmark and Belgium) have larger firms with an average size that, depending on the country, ranges from 51 to 31 employees per firm, while the countries of the 'periphery' (that include Spain, Italy, Portugal and Greece) have smaller firms with an average size that ranges from 20 to 5 employees per firm.
D. The Trade Relations of Greece with the EU and the World
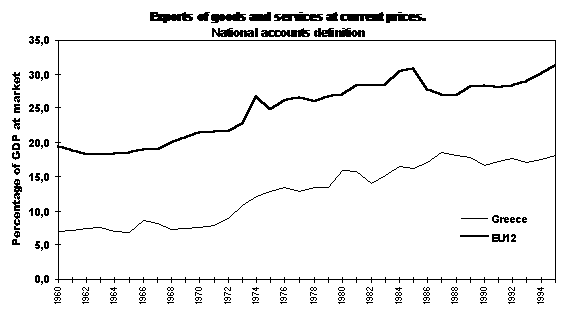
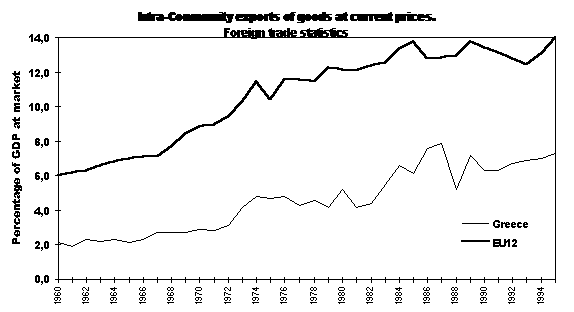
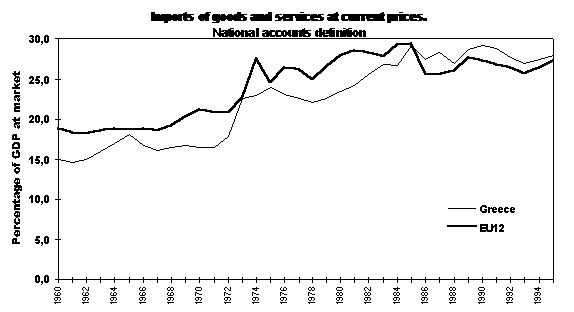
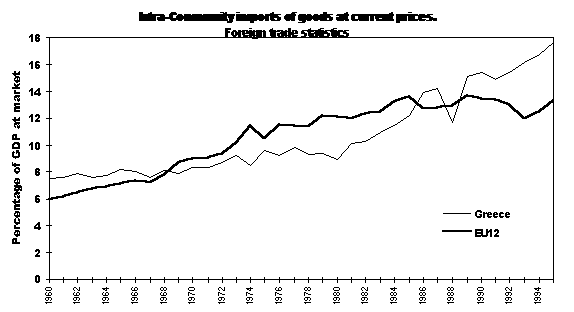
In Tables 7 and Diagram 5 we present data about the total and inta-Community exports and imports of Greece as a share of GDP for the period 1960-1995 and make comparisons with the respective EU figures. Looking first at the total exports as a share of GDP, we observe a consistently inferior performance of Greece when compared to the EU. The share of total exports to GDP in 1960 was 6.9% for Greece and 19.5% for the EU. The same share was 18.1% for Greece and 31.3% for the EU in 1995. As Diagram 5 shows, a difference of about 13 percentage points is maintained in the entire period. The situation is similar with respect to intra-Community exports as a share of GDP. Here however the Greek exports as a share of GDP have been growing with a slower pace than the average EU figure and the gap becomes over time wider. As is can be seen in the Table and the Diagram, this difference increased from about 4 percentage points in 1960 to about 7 percentage points in 1995, indicating the declining ability of Greek exports to penetrate the EU markets.
Turning to imports, the situation is very different. Total Greek imports as a share of GDP show a similar trend and are very close to the EU average figures throughout the period examined. Moreover, for the last ten years the share of Greek imports to GDP is greater than the respective EU figure. The same is also true for the intra-Cornmunity imports of Greece that as a share are very close to the EU average.
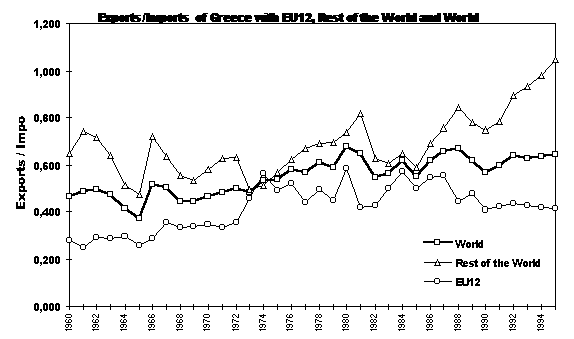
Table 8 and Diagram 6 present exports, imports and export/import ratios of Greece with the EU, the Rest of the World and total trade for the period 1960-1995. The crucial variable here is the export/import ratio that measures the value of exports of Greece that correspond to a dollar of imports. A ratio greater than one indicates that every dollar of imports in Greece is more than matched by Greek exports. Therefore, higher than one values indicate a positive for Greece balance of trade, while lower than one values indicate a negative balance of trade. Another way to interpret this ratio is to think of it as the degree of relative penetration of a foreign market by Greek products.
Looking at the export/import ratio in Table 8 and Diagram 6, we can make a number of observations: First, the Greek export/import ratio with the EU is consistently smaller than one for the entire period and also consistently smaller than the export/import ratio of the country
with the Rest of the World and Total Trade. Second, during the last ten years the export/import ratio of Greece with the EU is declining, indicating that for each ecu of imports from the EU, Greece manages to export products of a declining value over time. For 1995 the value of Greek exports to the EU were equal to only 41.4% of the value of its imports, a figure well bellow the 55.6% figure of 1987. Third, during the last ten years, the export/import ratio of Greece with the Rest of the World is increasing and it has became for the first time positive in 1995, indicating that in this year, Greece run for the first time a surplus in its trade with all the other countries except the EU members.
The observations made above, indicate that during the last period two different in direction processes take place with respect to the Greek performance in international markets. On the one hand there is the deteriorating position of Greek exports in the EU markets and on the other hand, there is a successful export performance in the other - except EU - markets
Interpreting these figures, it becomes obvious that the competitiveness of the Greek economy in the EU markets is low and declining, while its competitiveness in the other markets is at higher levels and increasing. Higher competitiveness in these markets seems to be affected by the new economic environment that has been created in the post-1989 European space, that allowed economic relations with neighbouring and nearby countries, an option that was not available to Greece for many decades (Petrakos and Christodoulakis 1996).
It is also interesting to observe in these figures, that despite the existence of the single European market and the fact that the Greek products do not face anymore tariff or non-tariff barriers in the EU, their ability to penetrate the EU market is lower, compared to the World and the Rest of the World markets, where certain barriers to trade exist. This may be an indication of the difficulties of integration arnong basically unequal and distant partners.
E. The Public Sector in Greece
One of the most widely shared explanations about the factors that have caused the declining performance of the Greek economy in the last 15 years is directly associated with the role of the public sector and especially the size of government (10). According to this argument, an important factor responsible for the sluggish performance of the economy is the fast expansion of the public sector in the 1980s and its strong intervention in the economy. The expansion of the public sector, according to this argument, generates deficits that are inflationary and drive the real interest rates up, discouraging private investment and slowing down the growth rate of the economy. In addition, the public sector is by definition less productive than the private one, as the structure of incentives for public employees does not always promote efficiency and bureaucratic mechanisms and regulation interfere with market operation. The policy implications of this argument can be summed up in one sentence: if the policy goal is to promote higher growth rates in the economy, then the size of the public sector must be reduced.
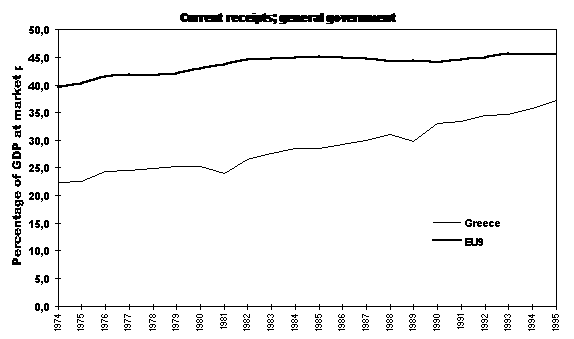
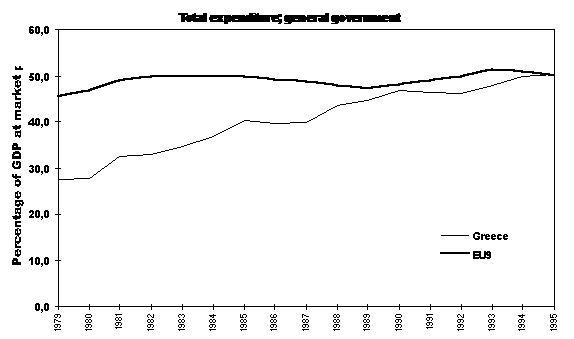
Since this argument has been often used in Greece to explain the performance of the economy (Alosgoskoufis 1993), it is interesting to examine over-time its size in comparison with that of the EU as a whole and the other member States. In Table 9 and Diagram 7 we present information about the total revenues and total expenditures of the general government as a share of GDP for Greece and the EU (11). Although information for Greece is not available for the entire period, two interesting observations can be made on the basis of existing data. First, throughout the 1980s the GDP share of public expenditures in Greece was indeed increasing, but the figure was consistently lower than the average EU figure. Only in the 1990-1995 period the Greek share approached significantly and reached the EU one. Second, throughout the period examined, the GDP share of public revenues in Greece are consistently lower than the EU by a margin greater or equal to 10 percentage points. These observations lead to the conclusion that the public sector in Greece is not proportionally larger than that of the EU.
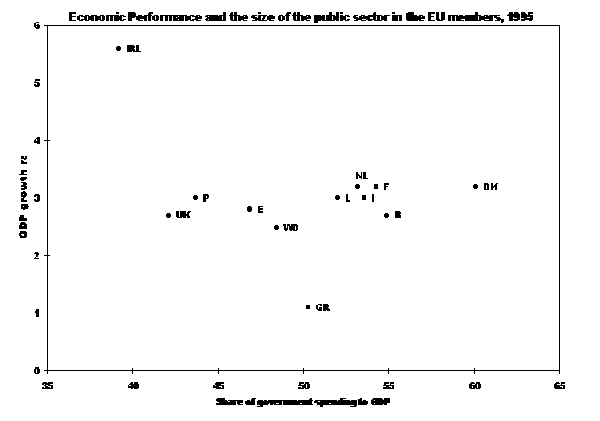
These observations cast some doubt to the most widely shared explanations about the performance of the Greek economy. The worse than average performance of Greece cannot be explained by the large size of the public sector alone for two reasons. First, because the public sector in Greece is not proportionally larger than that of the EU and second, because this way of causation is not empirically justified, as the countries with the larger share of public sector do not seem to have a worse economic performance in terms of lower GDP growth rates. In
Diagram 8 we present a graphical correlation of the GDP growth rates (in the vertical axis) and the. share of government spending to GDP for the countries of the EU in 1995. We observe that a satisfactory economic performance (2.5%-3.5% GDP growth rates) is compatible with a wide range of relative sizes of the public sector. Thus, Denmark, the Netherlands, France and Italy, that have a relatively larger public sector, have done equally well or better than UK., Portugal, Spain or Germany that have a relatively smaller one. In fact there are five country-members of the EU that have a relatively smaller public sector than Greece and have done better in terms of GDP growth in 1995 and six more countries that have a relatively larger public sector than Greece, with also a better performance during the same period. The point of this analysis is that the poor performance of Greece relatively to the other EU countries cannot be convincingly attributed to the size of the public sector alone, as many other countries with larger public sector have a clearly better performance.
F. Some Explanations for the Performance of Greece in the EU
In the previous part of the analysis we have examined, on a comparative basis, important aspects of the characteristics and the performance of the Greek economy, giving an emphasis on its performance during the last 15 years that Greece is a member of the EU. In our view, two are the central points of this analysis.
First, Greece is characterized by a weak economic structure with a high share of agriculture and a low and declining share of industry in GDP. From all the other Southern European country-members of the EU, Greece maintains by far the highest dependence on agriculture. In addition, industrial activities are concentrated in traditional labor-intensive and light-industry sectors and take place in very small by international standards firms. The last point is worth some consideration, as the average industrial firm in Greece has a size that is less than the one-fifth of the size of the average industrial firm in the EU.
Second, Greece appears over time with a limited ability to compete in international markets, as shown by the export/GDP ratio, which is by far the lowest in the EU. For comparison, the export/GDP ratio in the lagging behind countries of the EU for the 1971-1980 period were 16.5% for Greece, 33.5% for Portugal, 19.5% for Spain and 55.3% for Ireland. After membership and especially during the last ten years, the ability of the economy to compete in the international markets has been showing two distinct and opposite trends. Competitiveness in the EU market (as shown by export/import ratios) is declining and competitiveness in the other (except EU markets) is increasing. This peculiarity may be explainable in terms of the difficulties of integration among unequal partners on the one hand and by the dramatic changes that have taken place in the northern borders of the country because of the process of transition, on the other.
Overall, it can be argued that weak economic and especially industrial structure and the low international competitiveness of Greece intensified as the economic environment of the country became more international and led to a divergence from the EU average post 1981.
This, has not been totally unexpected. Several studies in the literature have already indicated that the dynamics of integration may have an overall unfavorable impact on the performance of the less developed states of the EU. However, although several Objective One Regions (12) (OlRs) have experienced similar difficulties, Greece is the only member state with an overall negative convergence record since joining the EU.
Although the issue of the disappointing performance of Greece, compared to the other 'Southern European' members is rather complicated, one possible explanation is that Greece has been a 'victim' of (the failure of its government and the public sector to play the game of) strategic trade and competitive bidding. Not only has been little in the 1980s by way of restructuring the economy to focus on high- return sectors, but European and 'foreign' TNCs have been turned away by anti-TNCs and anti-EU rhetoric. This factor, along with the relative decline of labor costs for TNC investment and the relatively weak power of Greece vis-a-vis lNCs, may explain in part, what is possibly the most remarkable recent economic failure in the West.
According to another argument, however (Petrakos and Christodoulakis 1996), Greece has been confronted in the post-war period with a uniquely unfavorable situation not found anywhere else in Europe. This situation resulted from the interaction of (a) a peripheral location in Southeastern Europe, away from major markets and the European development center (b) a physical isolation from the other western European countries due to the lack of common borders with them and (c) the fact that the only borders of the country were along the 'iron curtain' and as a result they were, due to the post war realities, meant to be real barriers to communication and trade with neighboring countries. This type of "border conditions", where practically the entire continental border-line of the country operated as a barrier to economic and social relations with all neighboring countries, forcing the main bulk of economic relations of the country to be with distant and more developed partners, is a rare situation in the history of international relations.
These conditions contributed to severe distortions in the sphere of external economic relations, with serious long term implications for the economic structure and performance of the country. The isolation and distance from the European core and the other Western European countries implied in general limited accessibility of domestic products to large foreign markets, explaining the low export-to-GDP ratios, while the "missing factor" in the trade relations with its neighbors generated serious disadvantages. Theoretical and empirical research has shown the importance of geographical factors such as adjacency and proximity in trade relations (Krugman 1994, 1995, Peschel 1990, 1992). As a result, the "missing factor" in the trade relations of Greece might have contributed to a reduction in the trade potential of the country limiting market accessibility for exporting industries and limiting the prospects for export-led growth.
Because of these conditions the trade relations of Greece took an inter-industry character with the more advanced and distant countries of Western Europe (Petrakos 1995), with a serious impact on the industrial structure of the country. Trade theory indicates (Gruber and Lloyd 1975, Greenway and Milner 1986, Grimwade 1989) that trade with neighboring countries is more intensive and usually takes an intra-industry character, implying greater room for more industries to develop, as international specializations are not mutually exclusive and the division of labor takes place within and not between sectors. Therefore, the lack of trade relations with the other Balkan countries, pushed Greece further towards an inter-industry type of specialization with the technologically more advanced western European countries (13) that was rather unfavorable for the industrial development of the country. In that respect, the post-war "border conditions" of the country have generated a "missing factor" in trade relations that in its turn has imposed additional constraints to the already weak structure of the economy. In addition, due to the small size of the country and the lack of accessible markets with a critical size, industrial firms could not benefit from economies of scale. This explains why the industrial base of the country became the most fragmented in Europe, a condition that deteriorated the structural problems of the economy and reduced overall economic efficiency.
The operation of these two factors (limited accessibility to European markets and no economic relations with neighboring countries) may explain some aspects of the Greek economic performance during the last decades. Distance and the "missing factor" in trade relations may explain, for example, why the dynamism of the economy in the 1950s and the 1960s was exhausted so quickly afterwards, or why the public sector in the late 70s and the 1980s became so popular and grew faster: As export-led growth was limited, the industrial sector unavoidably took an inward looking character, became more fragmented, less efficient and of course smaller in size, leaving to the public sector the responsibility to absorb the expanding, due to strong urban migration flows, labor force,
Overall, it is claimed here that the performance of the Greek economy in the post-war and pre-1989 period has been affected by the restrictions imposed on the structure and level of the external economic relations of the country by the limitations of geography and the artificial division of Europe into two camps. Although there is no direct empirical evidence to this point to support this argument, we are confident that a simple spatial trade model would predict for Greece a very different level and structure of trade (in terms of its composition by product and origin-destination by country) than the existing one, should barriers to trade with the neighboring countries were not imposed.
We have examined in this article the performance of Greece as a member of the EU, taking a comparative approach with respect to its previous record and with respect to the average EU figures. The analysis has indicated that Greece had in the entire period an inferior record with respect to economic and especially industrial structure, as well as international competitiveness than the EU average and that this record has deteriorated in many ways during the last 15 years that Greece is a member of the EU.
Three major explanations have been advanced to account for this performance. The first one, in line with the new theory of international trade, claims that the failure of the country to undertake a converging path after membership is due to the lack of strategic trade and competitive bidding policies in the late 1970s and the 1980s, as well as the diminishing importance of labor costs in affecting TNCs' location decisions. The second explanation claims that the performance of the economy in the post-war period has been seriously and negatively affected by the restrictions imposed on external economic relations by the limitations of geography and the artificial division of Europe into two camps. Finally the third, in line with a growing body of literature, claims that the negative impact of these effects, has been intensified by the dynamics of the on-going process of economic integration among unequal partners in Europe.
We believe that our analysis has two important policy implications for the Balkan economies in transition that have to be discussed. First, given that the decision to internationalize their economies and integrate in the long run with the EU has been taken on the basis of both economic and political considerations, a question arises about the type of this integration process. It has already been indicated in the literature (Landesmann 1995) that an interindustry (H-O) type of trade relations is already taking place between CEE and EU countries, with the former specializing in resources and labor intensive products and the later in technology, capital and human capital intensive products. This type of specialization and trade could over-time seriously affect the industrial structure of these countries. The experience of Greece has shown that a N-S type of integration between unequal partners may intensify existing structural problems and under certain condition may lead to divergence, instead of convergence in terms of economic performance and standards of living.
A first implication of this analysis is that, under any circumstances, the process of internationalization and integration of the Balkan economies in transition will be a difficult and painful one, given the structural and institutional problems they face. To the extent that this process takes the same form as in the case of Greece (or worse), it will generate severe pressures to their economic and especially industrial bases. This pressure will take the form of intensive competition in the international and domestic markets by the more advanced Western European enterprises that may have over time a triple impact: (a) an overall decline of the industrial share in output, well bellow existing levels, (b) a relative contraction of technology and human capital intensive sectors and a concentration of activities to labour and resource intensive ones and (c) increasing trade deficits in manufacturing products that will more than outweigh possible trade surpluses in agricultural products and raw materials or fuel. This type of impact however generates a real danger for a new divide in Europe, where over-time the "Southeast" will replace the "South" in forming gradually the new European periphery.
Second, the analysis of the Greek case shows that the size of the public sector may not always be responsible for the poor performance of the economy. Although in CEE countries privatization will most likely go on, it should be kept in mind that there are theoretical and practical limits to this effort. A relatively large public sector is a typical situation in Western Europe and as our analysis has shown, does not necessarily imply a weaker economic performance. In that respect, Balkan economies in transition have to proceed with privatization not on the basis of their experience with the "socialist" state, but on the basis of the EU experience that needs to be carefully and in depth analyzed.
Third, the experience of Greece has shown the importance of the role of geography in trade relations and development. Lack of economic relations with neighboring countries may lead to a serious trade dependence from more advanced industrial ones with adverse implications for the industrial structure of the economy. As a critical market size for many industrial sectors is usually not attained within national boundaries, cross-border relations become essential for the survival of industrial sectors that have not possessed yet technological know-how to compete in the more advanced Western European markets. Given that in the new European economic order (measured by population potential or gravity models) the Balkan countries, because of small market size and limited accessibility to the European core, get a low ranking in the PanEuropean hierarchy of states and regions (Petrakos 1996c), the prospects for a balanced process of integration with the already divided EU are limited. This implication is particularly important for the Balkan countries since historical rivalries, ethnic minorities and the recent war have imposed several real or psychological barriers to regional economic cooperation, that will further intensify the problem of small domestic market size and lead to inferior and further declining industrial structures.
Footnotes:
(3) Greece was the 10th member of the EU (then called European Economic Community, EEC) following West Germany, France, Italy, U.K., Ireland, Belgium, Luxembourg, the Netherlands and Denmark. Two more countries, Portugal and Spain, joined the EU in 1986 and three more, Sweden Finland and Austria in 1995. Also, West and East Germany united in 1991, adding to the EU a population of about 16 million. In the analysis that follows all references to EU are for the EU12-, that is excluding the territory and the economy of former East Germany and also excluding the last three members of the Union.
(4 ) The most commongly stated argument in support of membership was then that as a part of the EEC the country would be in a better possition to deal with (a) Turkish agression and expansionism and (b) maintain democratic rules in the country.
(5) The process of reforms in the former Socialist countries and the apparent end of cold war, has arguably helped to eliminate internal divides over the desirability of joining the EU
(6) This is true with the exemption of 1974. In this year economic indicators have been affected, besides the oil crisis. also by the Turkish invation to Cyprus and the fall of the military junta in Athens
(7) Figures for 1961 and 196' are not available
(8) To some extent, the increase of the share of the tertiary sector can be seen as a defensive adjustment, as the economy moves away from activities exposed to international competition and towards mostly non-tradable activities with a local character.
(9) Recent studies show that the elimination of trade barriers (because of the single European market) will seriously affect most labor-intensive sectors protected to a relatively higher degree than the less significant in terms of output capital-intensive sectors (CEC 1990, Hassid and Katsos 1992).
(10) The term government here is used with the broad sense of the word and includes public utilities, public corporations and subsidiaries as well as a significant part of the banking sector.
(11) Excluding Luxemburg
(12) That is regions with a GDP per head lower than 75% of the EU average.
(13) This may explain why from all the EU countries, Greece has the lowest share of intra-industry trade.
GDP, GDP per person employed, Industrial production and Gross fixed
capital formation at 1985 market prices
(Annual percentage change)
| GDP at 1985 market prices | GDP at 1985 market prices per person employed | Industrial production Construction excluded | Gross fixed capital formation at 1985 prices; total economy. | |||||
| YEARS | Greece | EU12 | Greece | EU12 | Greece | EU12 | Greece | EU12 |
|
1961 |
11,1 |
5,5 |
10,7 |
4,8 |
5,6 |
8,1 |
9,8 | |
|
1962 |
1,5 |
4,7 |
2,6 |
4,4 |
6,3 |
8,4 |
5,9 | |
|
1963 |
10,1 |
4,5 |
11,7 |
4,5 |
10,7 |
6,1 |
5,5 |
4,7 |
|
1964 |
8,3 |
5,8 |
9,6 |
5,3 |
10,9 |
6,7 |
20,7 |
9,6 |
|
1965 |
9,4 |
4,4 |
10,2 |
4,2 |
8,4 |
4,7 |
12,8 |
4,0 |
|
1966 |
6,1 |
3,9 |
7,1 |
3,9 |
16,1 |
5,5 |
3,2 |
4,7 |
|
1967 |
5,5 |
3,4 |
6,8 |
4,2 |
4,3 |
2,3 |
-1,6 |
3,8 |
|
1968 |
6,7 |
5,3 |
7,9 |
5,4 |
7,8 |
7,2 |
21,4 |
6,4 |
|
1969 |
9,9 |
6,0 |
10,3 |
5,0 |
11,8 |
8,9 |
18,6 |
6,9 |
|
1970 |
8,0 |
4,7 |
8,1 |
4,1 |
10,6 |
5,3 |
-1,4 |
5,0 |
|
1971 |
7,1 |
3,2 |
6,8 |
3,1 |
11,2 |
1,9 |
14,0 |
3,4 |
|
1972 |
8,9 |
4,3 |
8,3 |
4,2 |
14,2 |
5,7 |
15,4 |
4,0 |
|
1973 |
7,3 |
6,2 |
6,2 |
4,5 |
15,2 |
8,6 |
7,7 |
6,1 |
|
1974 |
-3,6 |
2,0 |
-3,8 |
1,6 |
-1,4 |
1,6 |
-25,6 |
-2,4 |
|
1975 |
6,1 |
-0,9 |
6,0 |
0,2 |
4,3 |
-6,7 |
0,2 |
-5,3 |
|
1976 |
6,4 |
4,7 |
5,1 |
4,7 |
10,5 |
7,4 |
6,8 |
2,1 |
|
1977 |
3,4 |
2,9 |
2,6 |
2,5 |
1,6 |
2,6 |
7,8 |
1,1 |
|
1978 |
6,7 |
3,2 |
6,2 |
2,8 |
7,5 |
2,7 |
6,0 |
2,2 |
|
1979 |
3,7 |
3,5 |
2,6 |
2,5 |
5,9 |
4,5 |
8,8 |
3,3 |
|
1980 |
1,8 |
1,3 |
0,4 |
0,9 |
0,9 |
0,3 |
-6,5 |
1,7 |
|
1981 |
0,1 |
0,1 |
-4,9 |
1,2 |
0,9 |
-1,8 |
-7,5 |
-5,0 |
|
1982 |
0,4 |
0,8 |
1,2 |
1,6 |
1,1 |
-1,2 |
-1,9 |
-1,9 |
|
1983 |
0,4 |
1,6 |
-0,7 |
2,2 |
0,0 |
0,9 |
-1,3 |
0,0 |
|
1984 |
2,8 |
2,3 |
2,4 |
2,1 |
1,6 |
2,0 |
-5,7 |
0,9 |
|
1985 |
3,1 |
2,5 |
2,1 |
2,0 |
3,4 |
3,3 |
5,2 |
2,1 |
|
1986 |
1,6 |
2,9 |
1,3 |
2,2 |
-0,2 |
2,4 |
-6,2 |
4,1 |
|
1987 |
-0,5 |
2,9 |
-0,4 |
1,7 |
-1,7 |
2,1 |
-5,1 |
5,4 |
|
1988 |
4,4 |
4,3 |
2,7 |
2,6 |
5,7 |
4,4 |
8,9 |
8,7 |
|
1989 |
4,0 |
3,5 |
3,6 |
1,9 |
1,5 |
3,7 |
7,1 |
7,0 |
|
1990 |
-1,0 |
2,9 |
-2,3 |
1,2 |
-1,9 |
1,8 |
8,4 |
3,8 |
|
1991 |
3,2 |
1,7 |
5,6 |
1,6 |
-1,5 |
-0,2 |
-4,5 |
-0,3 |
|
1992 |
0,8 |
1,0 |
-0,6 |
1,6 |
-1,0 |
-1,2 |
0,5 |
-1,3 |
|
1993 |
-0,5 |
-0,5 |
-1,5 |
1,4 |
-3,1 |
-3,5 |
-2,7 |
-6,5 |
|
1994 |
0,4 |
2,5 |
0,7 |
3,1 |
1,5 |
3,5 |
0,8 |
1,5 |
|
1995 |
1,1 |
2,8 |
0,9 |
2,1 |
1,6 |
3,8 |
2,7 |
5,0 |
Source:
EUROPEAN ECONOMY,
Annual Economic
Report for 1995,
No 59 1995: Tables 10, 11, 12, 22, pages 200-202, 212.
Unemployment rate; total
(Percentage of civilian labour force)
| YEARS | Greece | EU12 |
|
1960 |
||
|
1961 |
||
|
1962 |
5,1 |
|
|
1963 |
5,0 |
|
|
1964 |
4,7 |
1,9 |
|
1965 |
4,8 |
2,0 |
|
1966 |
5,0 |
2,1 |
|
1967 |
5,4 |
2,6 |
|
1968 |
5,6 |
2,7 |
|
1969 |
5,3 |
2,4 |
|
1970 |
4,2 |
2,4 |
|
1971 |
3,1 |
2,6 |
|
1972 |
2,1 |
2,9 |
|
1973 |
2,0 |
2,6 |
|
1974 |
2,1 |
2,8 |
|
1975 |
2,3 |
4,1 |
|
1976 |
1,9 |
4,7 |
|
1977 |
1,7 |
5,0 |
|
1978 |
1,8 |
5,3 |
|
1979 |
1,9 |
5,4 |
|
1980 |
2,8 |
6,0 |
|
1981 |
4,0 |
7,7 |
|
1982 |
5,8 |
9,0 |
|
1983 |
7,9 |
9,9 |
|
1984 |
8,1 |
10,5 |
|
1985 |
7,8 |
10,8 |
|
1986 |
7,4 |
10,7 |
|
1987 |
7,4 |
10,4 |
|
1988 |
7,7 |
9,8 |
|
1989 |
7,5 |
9,0 |
|
1990 |
7,0 |
8,4 |
|
1991 |
7,7 |
8,7 |
|
1992 |
8,7 |
9,4 |
|
1993 |
9,7 |
10,5 |
|
1994 |
10,2 |
10,9 |
|
1995 |
10,6 |
10,4 |
Source:
EUROPEAN ECONOMY,
Annual Economic
Report for 1995,
No 59 1995: Table 3, page 193.
GDP at current market prices per head of population
| (ECU; EU12=100) | (PPS; EU12=100) | |||
| YEARS | Greece | EU12 | Greece | EU12 |
|
1960 |
47,9 |
100,0 |
42,7 |
100,0 |
|
1961 |
49,1 |
100,0 |
45,0 |
100,0 |
|
1962 |
47,9 |
100,0 |
43,8 |
100,0 |
|
1963 |
49,2 |
100,0 |
46,4 |
100,0 |
|
1964 |
50,3 |
100,0 |
47,7 |
100,0 |
|
1965 |
52,7 |
100,0 |
50,2 |
100,0 |
|
1966 |
54,4 |
100,0 |
51,3 |
100,0 |
|
1967 |
55,2 |
100,0 |
52,0 |
100,0 |
|
1968 |
57,3 |
100,0 |
52,9 |
100,0 |
|
1969 |
59,0 |
100,0 |
55,0 |
100,0 |
|
1970 |
59,3 |
100,0 |
57,0 |
100,0 |
|
1971 |
58,2 |
100,0 |
59,7 |
100,0 |
|
1972 |
55,3 |
100,0 |
61,9 |
100,0 |
|
1973 |
55,9 |
100,0 |
62,6 |
100,0 |
|
1974 |
58,8 |
100,0 |
59,2 |
100,0 |
|
1975 |
55,5 |
100,0 |
63,1 |
100,0 |
|
1976 |
57,6 |
100,0 |
63,5 |
100,0 |
|
1977 |
57,9 |
100,0 |
63,0 |
100,0 |
|
1978 |
56,1 |
100,0 |
64,6 |
100,0 |
|
1979 |
55,7 |
100,0 |
64,1 |
100,0 |
|
1980 |
50,5 |
100,0 |
64,1 |
100,0 |
|
1981 |
52,8 |
100,0 |
63,7 |
100,0 |
|
1982 |
57,0 |
100,0 |
63,2 |
100,0 |
|
1983 |
53,2 |
100,0 |
62,2 |
100,0 |
|
1984 |
53,5 |
100,0 |
62,2 |
100,0 |
|
1985 |
50,5 |
100,0 |
62,5 |
100,0 |
|
1986 |
43,6 |
100,0 |
61,7 |
100,0 |
|
1987 |
41,4 |
100,0 |
59,7 |
100,0 |
|
1988 |
43,0 |
100,0 |
59,9 |
100,0 |
|
1989 |
44,2 |
100,0 |
60,2 |
100,0 |
|
1990 |
43,9 |
100,0 |
58,2 |
100,0 |
|
1991 |
44,3 |
100,0 |
58,3 |
100,0 |
|
1992 |
44,5 |
100,0 |
59,7 |
100,0 |
|
1993 |
45,9 |
100,0 |
59,6 |
100,0 |
|
1994 |
45,5 |
100,0 |
58,3 |
100,0 |
|
1995 |
45,4 |
100,0 |
57,3 |
100,0 |
Source:
EUROPEAN ECONOMY,
Annual Economic
Report for 1995,
No 59 1995: Tables 8,9, pages 198, 199.
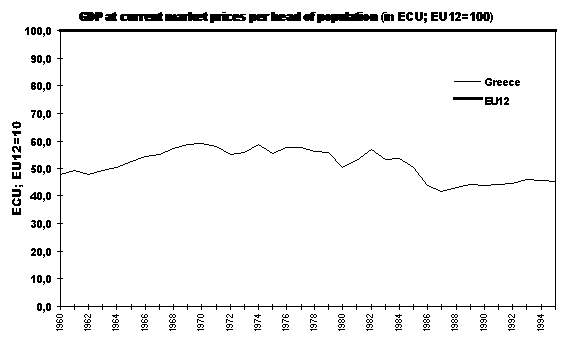
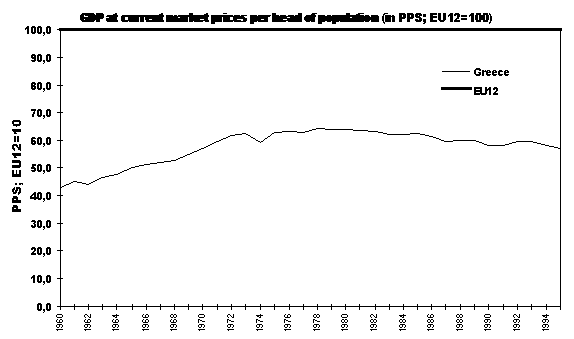
Table 4
Value added (%) of Agriculture (1),
Industry (2) and Services (3)
| Agriculture | Industry | Services | ||||
| Years | EU | Greece | EU | Greece | EU | Greece |
| 1983 |
3,7 |
16,9 |
59,1 |
53,3 | ||
| 1984 |
3,7 |
17,6 |
59,6 |
53,2 | ||
| 1985 |
3,4 |
17,3 |
36,5 |
29,3 |
60,0 |
53,5 |
| 1986 |
3,4 |
16,2 |
35,8 |
30,0 |
60,8 |
53,8 |
| 1987 |
3,2 |
15,8 |
35,1 |
28,8 |
61,6 |
55,4 |
| 1988 |
3,0 |
16,5 |
35,0 |
28,2 |
61,9 |
55,3 |
| 1989 |
3,1 |
16,3 |
34,9 |
27,8 |
62,0 |
55,8 |
| 1990 |
2,9 |
15,4 |
34,7 |
27,5 |
62,8 |
57,1 |
| 1991 |
2,8 |
16,3 |
33,8 |
27,4 |
63,3 |
56,3 |
| 1992 |
2,6 |
17,0 |
33,1 |
27,3 |
64,4 |
55,6 |
(1): Agriculture, Forest and Fishery.
(2): Fuel and
power, Manufacturing, Construction.
(3): Tradeable and Non-tradeable
Services.
Source: EUROSTAT, Statistical Survey 1995: pages 200, 202, 204,
206, 208, 210.
Industrial employment in Greece and the EU by sector 1985, 1990
| Greece | EU | |||||
|
Composition | ||||||
| ISIC | NACE | SECTOR |
1985 |
1990 |
1985 |
1990 |
|
30/31/32 |
25/48 |
Chemicals, Ruber and plastic |
10,78% |
11,40% |
12,03% |
12,89% |
|
36/37 |
32/34/37 |
Mechanical, Electrical and Instrument Engin. |
6,64% |
6,60% |
24,17% |
24,23% |
|
38 |
35/36 |
Transportation |
8,16% |
8,21% |
12,40% |
11,81% |
|
33 |
24 |
Non-metalic mineral products |
6,63% |
6,71% |
4,56% |
4,58% |
|
34/35 |
22/31 |
Production of metals and manufacturing of metal articles |
9,33% |
8,51% |
13,72% |
13,42% |
|
20/21/22 |
41/42 |
Food, Drink and Tobacco |
19,09% |
19,59% |
10,39% |
10,72% |
|
23 |
43 |
Textile |
16,23% |
13,66% |
5,89% |
5,04% |
|
24/29 |
44/45 |
Leather, footwear and clothing |
13,21% |
14,58% |
6,10% |
5,64% |
|
25/26 |
46 |
Timber and wooden furniture |
3,86% |
4,35% |
3,61% |
4,08% |
|
27/28 |
47 |
Paper and paper products |
5,04% |
5,45% |
6,10% |
6,52% |
|
39 |
49 |
Other industries |
1,03% |
0,95% |
1,03% |
1,07% |
| Total |
100,00% |
100,00% |
100,00% |
100,00% | ||
Source:
NSSG (1985, 1990),
EUROSTAT (1990,
1993) and own calculations.
Average employment in enterprises with one employee or more in the country members of the EU, 1990
|
Countries |
Industry |
|
Germany |
36 |
|
The U.K |
20 |
|
Italy |
18 |
|
France |
33 |
|
Spain |
17 |
|
Belgium |
32 |
|
Portugal |
20 |
|
Denmark |
31 |
|
Luxembourg |
51 |
|
Netherland |
49 |
|
Greece |
5 |
|
EU |
27 |
Source : EC ( 1994 )
Exports and imports of goods and services and Intra-Community exports
and imports of goods at current prices
(percentage of GDP at market
prices)
|
Exports of goods and services |
Imports of goods and services |
Intra-Community exports of goods |
Intra-Community imports of goods | |||||
| YEARS | Greece | EU12 | Greece | EU12 | Greece | EU12 | Greece | EU12 |
|
1960 |
6,9 |
19,5 |
14,9 |
18,9 |
2,1 |
6,0 |
7,5 |
6 |
|
1961 |
7,1 |
18,9 |
14,6 |
18,3 |
1,9 |
6,2 |
7,6 |
6,2 |
|
1962 |
7,4 |
18,3 |
15,0 |
18,2 |
2,3 |
6,3 |
7,9 |
6,4 |
|
1963 |
7,6 |
18,2 |
16,0 |
18,6 |
2,2 |
6,6 |
7,6 |
6,7 |
|
1964 |
7,0 |
18,4 |
16,9 |
18,8 |
2,3 |
6,8 |
7,7 |
6,9 |
|
1965 |
6,8 |
18,6 |
18,1 |
18,7 |
2,1 |
7,0 |
8,2 |
7,1 |
|
1966 |
8,6 |
19,0 |
16,7 |
18,9 |
2,3 |
7,1 |
8,0 |
7,3 |
|
1967 |
8,1 |
19,0 |
16,1 |
18,6 |
2,7 |
7,1 |
7,6 |
7,2 |
|
1968 |
7,3 |
20,0 |
16,4 |
19,3 |
2,7 |
7,7 |
8,1 |
7,8 |
|
1969 |
7,4 |
20,8 |
16,7 |
20,3 |
2,7 |
8,5 |
7,9 |
8,7 |
|
1970 |
7,6 |
21,5 |
16,4 |
21,1 |
2,9 |
8,9 |
8,3 |
9,0 |
|
1971 |
7,9 |
21,7 |
16,4 |
20,8 |
2,8 |
9,0 |
8,3 |
9,1 |
|
1972 |
8,9 |
21,7 |
17,9 |
20,7 |
3,1 |
9,4 |
8,7 |
9,4 |
|
1973 |
10,8 |
22,9 |
22,5 |
22,6 |
4,2 |
10,3 |
9,2 |
10,2 |
|
1974 |
12,2 |
26,7 |
22,9 |
27,6 |
4,8 |
11,5 |
8,5 |
11,5 |
|
1975 |
12,8 |
24,8 |
23,9 |
24,5 |
4,7 |
10,4 |
9,6 |
10,5 |
|
1976 |
13,4 |
26,1 |
23,0 |
26,5 |
4,8 |
11,6 |
9,2 |
11,6 |
|
1977 |
12,8 |
26,6 |
22,5 |
26,2 |
4,3 |
11,6 |
9,8 |
11,5 |
|
1978 |
13,4 |
26,0 |
22,0 |
24,9 |
4,6 |
11,5 |
9,3 |
11,4 |
|
1979 |
13,3 |
26,7 |
22,5 |
26,6 |
4,2 |
12,3 |
9,4 |
12,2 |
|
1980 |
15,9 |
27,0 |
23,4 |
28,0 |
5,2 |
12,2 |
8,9 |
12,1 |
|
1981 |
15,7 |
28,4 |
24,2 |
28,6 |
4,2 |
12,1 |
10,1 |
12,0 |
|
1982 |
14,0 |
28,4 |
25,6 |
28,4 |
4,4 |
12,4 |
10,3 |
12,3 |
|
1983 |
15,1 |
28,5 |
26,8 |
27,9 |
5,5 |
12,6 |
11,0 |
12,5 |
|
1984 |
16,5 |
30,4 |
26,7 |
29,4 |
6,6 |
13,4 |
11,5 |
13,2 |
|
1985 |
16,1 |
30,8 |
29,2 |
29,5 |
6,1 |
13,8 |
12,2 |
13,6 |
|
1986 |
17,0 |
27,7 |
27,5 |
25,7 |
7,6 |
12,8 |
13,9 |
12,7 |
|
1987 |
18,6 |
27,0 |
28,3 |
25,6 |
7,9 |
12,9 |
14,2 |
12,8 |
|
1988 |
18,1 |
26,9 |
27,0 |
26,1 |
5,2 |
13,0 |
11,7 |
12,9 |
|
1989 |
17,8 |
28,2 |
28,7 |
27,7 |
7,2 |
13,8 |
15,1 |
13,7 |
|
1990 |
16,6 |
28,3 |
29,2 |
27,3 |
6,3 |
13,5 |
15,4 |
13,5 |
|
1991 |
17,2 |
28,1 |
28,8 |
26,8 |
6,3 |
13,2 |
14,9 |
13,4 |
|
1992 |
17,7 |
28,3 |
27,7 |
26,4 |
6,7 |
12,8 |
15,4 |
13,0 |
|
1993 |
17,0 |
28,9 |
27,0 |
25,7 |
6,9 |
12,5 |
16,2 |
12,0 |
|
1994 |
17,5 |
30,1 |
27,5 |
26,4 |
7,0 |
13,1 |
16,8 |
12,5 |
|
1995 |
18,1 |
31,3 |
28,0 |
27,4 |
7,3 |
14,0 |
17,7 |
13,3 |
Source:
EUROPEAN ECONOMY,
Annual Economic
Report for 1995,
No 59 1995: Tables 38, 40, 42, 44, pages 228, 230, 232,
234.
International Trade of Greece 1961-1994
(Mrd ECU)
| EU12 | Rest of World | Total | |||||||
| Year |
Exports |
Imports |
Exp./Imp. |
Exports |
Imports |
Exp./Imp. |
Exports |
Imports |
Exp./Imp. |
|
1960 |
0,084 |
0,300 |
0,280 |
0,192 |
0,296 |
0,649 |
0,276 |
0,596 |
0,463 |
|
1961 |
0,084 |
0,334 |
0,250 |
0,229 |
0,308 |
0,743 |
0,312 |
0,642 |
0,486 |
|
1962 |
0,108 |
0,371 |
0,291 |
0,240 |
0,334 |
0,718 |
0,348 |
0,705 |
0,493 |
|
1963 |
0,117 |
0,403 |
0,289 |
0,286 |
0,445 |
0,643 |
0,403 |
0,848 |
0,475 |
|
1964 |
0,136 |
0,454 |
0,299 |
0,277 |
0,543 |
0,511 |
0,413 |
0,997 |
0,414 |
|
1965 |
0,141 |
0,549 |
0,256 |
0,315 |
0,663 |
0,475 |
0,456 |
1,213 |
0,376 |
|
1966 |
0,173 |
0,600 |
0,288 |
0,473 |
0,653 |
0,724 |
0,645 |
1,253 |
0,515 |
|
1967 |
0,219 |
0,616 |
0,355 |
0,437 |
0,689 |
0,635 |
0,656 |
1,304 |
0,503 |
|
1968 |
0,246 |
0,737 |
0,333 |
0,419 |
0,755 |
0,554 |
0,664 |
1,492 |
0,445 |
|
1969 |
0,281 |
0,822 |
0,342 |
0,489 |
0,915 |
0,534 |
0,770 |
1,737 |
0,443 |
|
1970 |
0,339 |
0,971 |
0,349 |
0,550 |
0,948 |
0,580 |
0,889 |
1,919 |
0,463 |
|
1971 |
0,353 |
1,046 |
0,337 |
0,643 |
1,021 |
0,630 |
0,995 |
2,066 |
0,482 |
|
1972 |
0,419 |
1,175 |
0,356 |
0,783 |
1,242 |
0,630 |
1,202 |
2,417 |
0,497 |
|
1973 |
0,659 |
1,444 |
0,457 |
1,036 |
2,088 |
0,496 |
1,696 |
3,533 |
0,480 |
|
1974 |
0,907 |
1,607 |
0,565 |
1,399 |
2,722 |
0,514 |
2,306 |
4,328 |
0,533 |
|
1975 |
0,949 |
1,939 |
0,490 |
1,636 |
2,889 |
0,566 |
2,586 |
4,828 |
0,536 |
|
1976 |
1,162 |
2,226 |
0,522 |
2,081 |
3,340 |
0,623 |
3,243 |
5,566 |
0,583 |
|
1977 |
1,178 |
2,685 |
0,439 |
2,329 |
3,480 |
0,669 |
3,507 |
6,165 |
0,569 |
|
1978 |
1,371 |
2,771 |
0,495 |
2,622 |
3,785 |
0,693 |
3,993 |
6,556 |
0,609 |
|
1979 |
1,420 |
3,177 |
0,447 |
3,076 |
4,428 |
0,695 |
4,495 |
7,605 |
0,591 |
|
1980 |
1,799 |
3,079 |
0,584 |
3,702 |
5,017 |
0,738 |
5,501 |
8,096 |
0,679 |
|
1981 |
1,676 |
4,030 |
0,416 |
4,589 |
5,626 |
0,816 |
6,264 |
9,656 |
0,649 |
|
1982 |
2,081 |
4,872 |
0,427 |
4,541 |
7,237 |
0,627 |
6,622 |
12,109 |
0,547 |
|
1983 |
2,602 |
5,203 |
0,500 |
4,541 |
7,473 |
0,608 |
7,142 |
12,676 |
0,563 |
|
1984 |
3,412 |
5,946 |
0,574 |
5,118 |
7,858 |
0,651 |
8,531 |
13,804 |
0,618 |
|
1985 |
3,196 |
6,393 |
0,500 |
5,240 |
8,908 |
0,588 |
8,436 |
15,301 |
0,551 |
|
1986 |
3,663 |
6,700 |
0,547 |
4,531 |
6,555 |
0,691 |
8,194 |
13,255 |
0,618 |
|
1987 |
3,808 |
6,844 |
0,556 |
5,157 |
6,796 |
0,759 |
8,965 |
13,641 |
0,657 |
|
1988 |
2,818 |
6,341 |
0,444 |
6,992 |
8,293 |
0,843 |
9,810 |
14,634 |
0,670 |
|
1989 |
4,356 |
9,136 |
0,477 |
6,413 |
8,228 |
0,779 |
10,769 |
17,364 |
0,620 |
|
1990 |
4,057 |
9,918 |
0,409 |
6,633 |
8,887 |
0,746 |
10,690 |
18,805 |
0,568 |
|
1991 |
4,435 |
10,490 |
0,423 |
7,674 |
9,786 |
0,784 |
12,109 |
20,275 |
0,597 |
|
1992 |
4,945 |
11,365 |
0,435 |
8,118 |
9,077 |
0,894 |
13,063 |
20,443 |
0,639 |
|
1993 |
5,292 |
12,425 |
0,426 |
7,747 |
8,284 |
0,935 |
13,039 |
20,709 |
0,630 |
|
1994 |
5,565 |
13,356 |
0,417 |
8,348 |
8,507 |
0,981 |
13,913 |
21,863 |
0,636 |
|
1995 |
6,081 |
14,744 |
0,412 |
8,996 |
8,580 |
1,049 |
15,077 |
23,324 |
0,646 |
Source: Table 7, European economy (1995): Table 5 and own calculation.
Current receipts and Total expenditure; general government
(Percentage
of GDP at market prices)
| Current receipts | Total expenditure | |||||
| YEARS | Greece (1) | EU9 (2) | EU11 (3) | Greece (1) | EU9 (2) | EU11 (3) |
|
1960 |
21,1 |
32,2 |
32,2 |
|||
|
1961 |
22,0 |
33,2 |
33,1 |
|||
|
1962 |
23,2 |
33,9 |
34,2 |
|||
|
1963 |
24,0 |
34,0 |
35,2 |
|||
|
1964 |
23,7 |
34,2 |
34,9 |
|||
|
1965 |
25,3 |
34,6 |
36,2 |
|||
|
1966 |
26,2 |
35,2 |
36,2 |
|||
|
1967 |
27,3 |
36,1 |
37,7 |
|||
|
1968 |
27,2 |
37,0 |
38,6 |
|||
|
1969 |
26,8 |
37,9 |
38,6 |
|||
|
1970 |
37,7 |
38,0 |
||||
|
1971 |
37,7 |
38,2 |
||||
|
1972 |
37,6 |
39,2 |
||||
|
1973 |
38,4 |
39,4 |
||||
|
1974 |
22,3 |
39,5 |
38,0 |
41,5 |
||
|
1975 |
22,6 |
40,3 |
38,9 |
45,4 |
||
|
1976 |
24,3 |
41,5 |
40,1 |
45,2 |
||
|
1977 |
24,6 |
41,9 |
40,5 |
44,9 |
||
|
1978 |
24,9 |
41,7 |
40,5 |
45,5 |
||
|
1979 |
25,3 |
42,1 |
40,8 |
27,5 |
45,6 |
44,1 |
|
1980 |
25,2 |
43,1 |
41,9 |
27,6 |
46,8 |
45,5 |
|
1981 |
24,0 |
43,8 |
42,7 |
32,5 |
49,1 |
47,9 |
|
1982 |
26,6 |
44,6 |
43,4 |
33,0 |
49,8 |
48,7 |
|
1983 |
27,6 |
44,9 |
43,9 |
34,8 |
49,9 |
49,0 |
|
1984 |
28,5 |
45,1 |
44,0 |
36,9 |
50,0 |
49,1 |
|
1985 |
28,5 |
45,3 |
44,4 |
40,2 |
49,9 |
49,2 |
|
1986 |
29,3 |
45,0 |
44,2 |
39,6 |
49,3 |
48,7 |
|
1987 |
30,0 |
44,9 |
44,3 |
39,7 |
48,9 |
48,2 |
|
1988 |
31,2 |
44,4 |
43,7 |
43,6 |
47,9 |
47,3 |
|
1989 |
29,9 |
44,5 |
43,9 |
44,6 |
47,2 |
46,8 |
|
1990 |
32,9 |
44,2 |
43,7 |
46,8 |
48,1 |
47,7 |
|
1991 |
33,4 |
44,7 |
44,2 |
46,4 |
49,1 |
48,8 |
|
1992 |
34,5 |
45,0 |
44,6 |
46,2 |
50,0 |
49,6 |
|
1993 |
34,6 |
45,7 |
45,3 |
48,0 |
51,5 |
51,3 |
|
1994 |
35,8 |
45,6 |
45,2 |
49,9 |
50,9 |
50,7 |
|
1995 |
37,1 |
45,6 |
45,2 |
50,3 |
50,1 |
49,9 |
(1): Breaks in 1987/88.
(2): EU12 including WD and
excluding Greece, Spain and Luxembourg.
(3): EU12 including WD and excluding
Luxembourg.
Source:
EUROPEAN ECONOMY,
Annual Economic
Report for 1995,
No 59 1995: Tables 60, 61, pages 250, 256.
• • Copyright © IWB
e.V. 1996-2000 • Webmaster:
ohlendorf@eduvinet.de
• •
• • 800 x 600 recommended
• •